Udacity Self-Driving Car Nanodegree
CarND-Vehicle-Detection
The goals / steps of this project are the following:
-
Perform a Histogram of Oriented Gradients (HOG) feature extraction on a labeled training set of images and train a classifier Linear SVM classifier
-
Optionally, you can also apply a color transform and append binned color features, as well as histograms of color, to your HOG feature vector.
-
Note: for those first two steps don't forget to normalize your features and randomize a selection for training and testing.
-
Implement a sliding-window technique and use your trained classifier to search for vehicles in images. Run your pipeline on a video stream (start with the test_video.mp4 and later implement on full project_video.mp4) and create a heat map of recurring detections frame by frame to reject outliers and follow detected vehicles.
-
Estimate a bounding box for vehicles detected.
Imports
import matplotlib.image as mpimg
import matplotlib.pyplot as plt
import numpy as np
import cv2
import glob
from skimage.feature import hog
from sklearn.preprocessing import StandardScaler
from sklearn.cross_validation import train_test_split
import time
from sklearn.svm import LinearSVC
import matplotlib.image as mpimg
#import seaborn as sns
from mpl_toolkits.mplot3d import Axes3D
from scipy.ndimage.measurements import label
import pickle
%matplotlib inline
from scipy.ndimage.measurements import label
from collections import deque
from moviepy.editor import VideoFileClip
from IPython.display import HTML
import warnings

with warnings.catch_warnings():
    warnings.filterwarnings("ignore",category=DeprecationWarning)
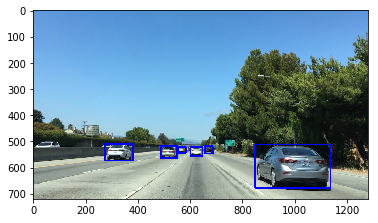
Manual Vehicle Detection
Drawing rectangles over an image
image = mpimg.imread('car.jpg')

# Define a function that takes an image, a list of bounding boxes,
# and optional color tuple and line thickness as inputs
# then draws boxes in that color on the output

def draw_boxes(img, bboxes, color=(0, 0, 255), thick=6):
    # Make a copy of the image
    draw_img = np.copy(img)
    # Iterate through the bounding boxes
    for bbox in bboxes:
        # Draw a rectangle given bbox coordinates
        cv2.rectangle(draw_img, bbox[0], bbox[1], color, thick)
    # Return the image copy with boxes drawn
    return draw_img

# Here are the bounding boxes I used
bboxes = [((275, 572), (380, 510)), ((488, 563), (549, 518)), ((554, 543), (582, 522)),
          ((601, 555), (646, 522)), ((657, 545), (685, 517)), ((849, 678), (1135, 512))]


result = draw_boxes(image, bboxes)
plt.imshow(result)
<matplotlib.image.AxesImage at 0x11d760908>

Templet Matching
# Here is your draw_boxes function from the previous exercise
def draw_boxes(img, bboxes, color=(0, 0, 255), thick=6):
    # Make a copy of the image
    imcopy = np.copy(img)
    # Iterate through the bounding boxes
    for bbox in bboxes:
        # Draw a rectangle given bbox coordinates
        cv2.rectangle(imcopy, bbox[0], bbox[1], color, thick)
    # Return the image copy with boxes drawn
    return imcopy


# Define a function to search for template matches
# and return a list of bounding boxes
def find_matches(img, template_list):
    # Define an empty list to take bbox coords
    bbox_list = []
    # Define matching method
    # Other options include: cv2.TM_CCORR_NORMED', 'cv2.TM_CCOEFF', 'cv2.TM_CCORR',
    #         'cv2.TM_SQDIFF', 'cv2.TM_SQDIFF_NORMED'
    method = cv2.TM_CCOEFF_NORMED
    # Iterate through template list
    for temp in template_list:
        # Read in templates one by one
        tmp = mpimg.imread(temp)
        # Use cv2.matchTemplate() to search the image
        result = cv2.matchTemplate(img, tmp, method)
        # Use cv2.minMaxLoc() to extract the location of the best match
        min_val, max_val, min_loc, max_loc = cv2.minMaxLoc(result)
        # Determine a bounding box for the match
        w, h = (tmp.shape[1], tmp.shape[0])
        if method in [cv2.TM_SQDIFF, cv2.TM_SQDIFF_NORMED]:
            top_left = min_loc
        else:
            top_left = max_loc
        bottom_right = (top_left[0] + w, top_left[1] + h)
        # Append bbox position to list
        bbox_list.append((top_left, bottom_right))
        # Return the list of bounding boxes

    return bbox_list
Application over a sample image
image = mpimg.imread('car.jpg')
#image = mpimg.imread('temp-matching-example-2.jpg')
templist = ['cutouts/cutout1.jpg', 'cutouts/cutout2.jpg', 'cutouts/cutout3.jpg',
            'cutouts/cutout4.jpg', 'cutouts/cutout5.jpg', 'cutouts/cutout6.jpg']
bboxes = find_matches(image, templist)
result = draw_boxes(image, bboxes)
plt.imshow(result)
<matplotlib.image.AxesImage at 0x11e16a978>
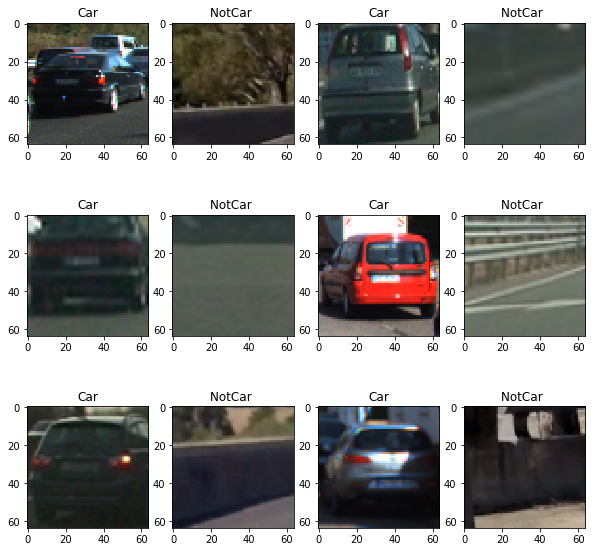
Getting familiar with Data
# Read in our vehicles and non-vehicles
cars = glob.glob('data/vehicles/**/*.png')
notcars = glob.glob('data/non-vehicles/**/*.png')
# Define a function to return some characteristics of the dataset
def data_look(car_list, notcar_list):
    data_dict = {}
    # Define a key in data_dict "n_cars" and store the number of car images
    data_dict["n_cars"] = len(car_list)
    # Define a key "n_notcars" and store the number of notcar images
    data_dict["n_notcars"] = len(notcar_list)
    # Read in a test image, either car or notcar
    example_img = mpimg.imread(car_list[0])
    # Define a key "image_shape" and store the test image shape 3-tuple
    data_dict["image_shape"] = example_img.shape
    # Define a key "data_type" and store the data type of the test image.
    data_dict["data_type"] = example_img.dtype
    # Return data_dict
    return data_dict
data_info = data_look(cars, notcars)

print('Your function returned a count of',
      data_info["n_cars"], ' cars and',
      data_info["n_notcars"], ' non-cars')
print('of size: ',data_info["image_shape"], ' and data type:',
      data_info["data_type"])
Your function returned a count of 8792  cars and 8968  non-cars
of size:  (64, 64, 3)  and data type: float32
fig = plt.figure(figsize=(10,10))
count = 1
for k in range (12):
    # Generate a random index to look at a car image
    if k%2 ==0:
        ind = np.random.randint(0, len(cars))
        Img = mpimg.imread(cars[ind])
        #fig-1
        fig.add_subplot(3,4,count)
        plt.imshow(Img)
        plt.title('Car')
        count += 1
    else:
        ind = np.random.randint(0, len(notcars))
        Img = mpimg.imread(notcars[ind])
        #fig-1
        fig.add_subplot(3,4,count)
        plt.imshow(Img)
        plt.title('NotCar ')
        count += 1
Feature Extraction
class FeatureExtraction(object):


    def __init__(self,hist_bins,hist_bins_range,spatial_size,\
                 orient,pix_per_cell,cell_per_block):

        self.hist_bins = hist_bins # hist_bins=32
        self.hist_bins_range= hist_bins_range # hist_bins_range = (0, 256)
        self.spatial_size=spatial_size # spatial_size=(32, 32)
        self.orient = orient # orient=9
        self.pix_per_cell = pix_per_cell # pix_per_cell=8
        self.cell_per_block = cell_per_block # cell_per_block=2


    def bin_spatial(self,img):
        # Use cv2.resize().ravel() to create the feature vector
        features = cv2.resize(img, self.spatial_size).ravel()
        # Return the feature vector
        return features


    def convert_color(self,img, cspace):
        if cspace == 'BGR':
            return cv2.cvtColor(img, cv2.COLOR_RGB2BGR)
        if cspace == 'YCrCb':
            return cv2.cvtColor(img, cv2.COLOR_RGB2YCrCb)
        if cspace == 'HSV':
            return cv2.cvtColor(img, cv2.COLOR_RGB2HSV)
        if cspace == 'LUV':
            return cv2.cvtColor(img, cv2.COLOR_RGB2LUV)
        if cspace == 'HLS':
            return cv2.cvtColor(img, cv2.COLOR_RGB2HLS)
        if cspace == 'YUV':
            return cv2.cvtColor(img, cv2.COLOR_RGB2YUV)


    '''Define a function to compute color histogram features '''

    def color_hist(self,img,plot_info=False):
        # Compute the histogram of the color channels separately
        ch1_hist = np.histogram(img[:,:,0],
                                     bins= self.hist_bins,
                                     range=self.hist_bins_range)

        ch2_hist = np.histogram(img[:,:,1],
                                     bins=self.hist_bins,
                                     range=self.hist_bins_range)

        ch3_hist = np.histogram(img[:,:,2],
                                     bins=self.hist_bins,
                                     range=self.hist_bins_range)
        bin_edges = ch1_hist[1]
        bin_centers = (bin_edges[1:]  + bin_edges[0:len(bin_edges)-1])/2

        # Concatenate the histograms into a single feature vector
        hist_features = np.concatenate((ch1_hist[0], ch2_hist[0], ch3_hist[0]))

        # Return the individual histograms, bin_centers and feature vector
        if plot_info:
            return  ch1_hist,ch2_hist,ch3_hist, bin_centers, hist_features
        else:
            return hist_features


    ''' Define a function to extract features from a list of images
        Have this function call bin_spatial() and color_hist()'''

    def extract_color_features(self,imgs, cspace='RGB'):

        # Create a list to append feature vectors to
        features = []
        # Iterate through the list of images
        for file in imgs:
            # Read in each one by one
            image = mpimg.imread(file)
            # apply color conversion if other than 'RGB'
            if cspace != 'RGB':
                feature_image = self.convert_color(image,cspace)
            else: feature_image = np.copy(image)


            # Apply bin_spatial() to get spatial color features
            spatial_features = self.bin_spatial(feature_image)

            # Apply color_hist() also with a color space option now
            hist_features = self.color_hist(feature_image)

            # Append the new feature vector to the features list
            features.append(np.hstack((spatial_features, hist_features)))


        # Return list of feature vectors
        return features


    def get_hog_features(self,img,vis,feature_vec):
        if vis == True:
            features, hog_image = hog(img,
                                  orientations=self.orient,
                                  pixels_per_cell=(self.pix_per_cell, self.pix_per_cell),
                                  cells_per_block=(self.cell_per_block, self.cell_per_block),
                                  transform_sqrt=False,
                                  visualise=True,
                                  feature_vector=feature_vec)

            return features, hog_image
        else:
            features = hog(img,
                       orientations=self.orient,
                       pixels_per_cell=(self.pix_per_cell, self.pix_per_cell),
                       cells_per_block=(self.cell_per_block, self.cell_per_block),
                       transform_sqrt=False,
                       visualise=False,
                       feature_vector=feature_vec)

            return features


    ''' Define a function to extract features from a list of images
        Have this function call bin_spatial() and color_hist()'''

    def extract_hog_features(self,imgs, cspace='RGB', hog_channel=0):
        # Create a list to append feature vectors to
        features = []
        # Iterate through the list of images
        for file in imgs:
            # Read in each one by one
            image = mpimg.imread(file)
            # apply color conversion if other than 'RGB'
            if cspace != 'RGB':
                feature_image = self.convert_color(image,cspace)
            else: feature_image = np.copy(image)

            # Call get_hog_features() with vis=False, feature_vec=True
            if hog_channel == 'ALL':
                hog_features = []
                for channel in range(feature_image.shape[2]):
                    hog_features.append(self.get_hog_features(feature_image[:,:,channel],
                                                              vis=False,
                                                              feature_vec=True))
                hog_features = np.ravel(hog_features)
            else:
                hog_features = self.get_hog_features(feature_image[:,:,hog_channel],
                                                     vis=False,
                                                     feature_vec=True)

            # Append the new feature vector to the features list
            features.append(hog_features)
        # Return list of feature vectors
        return features
Application of some feature extraction techniques
colorspace = 'RGB' # Can be RGB, HSV, LUV, HLS, YUV, YCrCb
orient = 9
pix_per_cell = 8
cell_per_block = 2
hog_channel = "ALL" # Can be 0, 1, 2, or "ALL"
hist_bins = 32
hist_bins_range = (0,256)
spatial_size = (32,32)

FE = FeatureExtraction(hist_bins = hist_bins,\
                            hist_bins_range =  hist_bins_range,\
                            spatial_size = spatial_size,\
                            orient = orient,\
                            pix_per_cell =  pix_per_cell,\
                            cell_per_block =  cell_per_block)
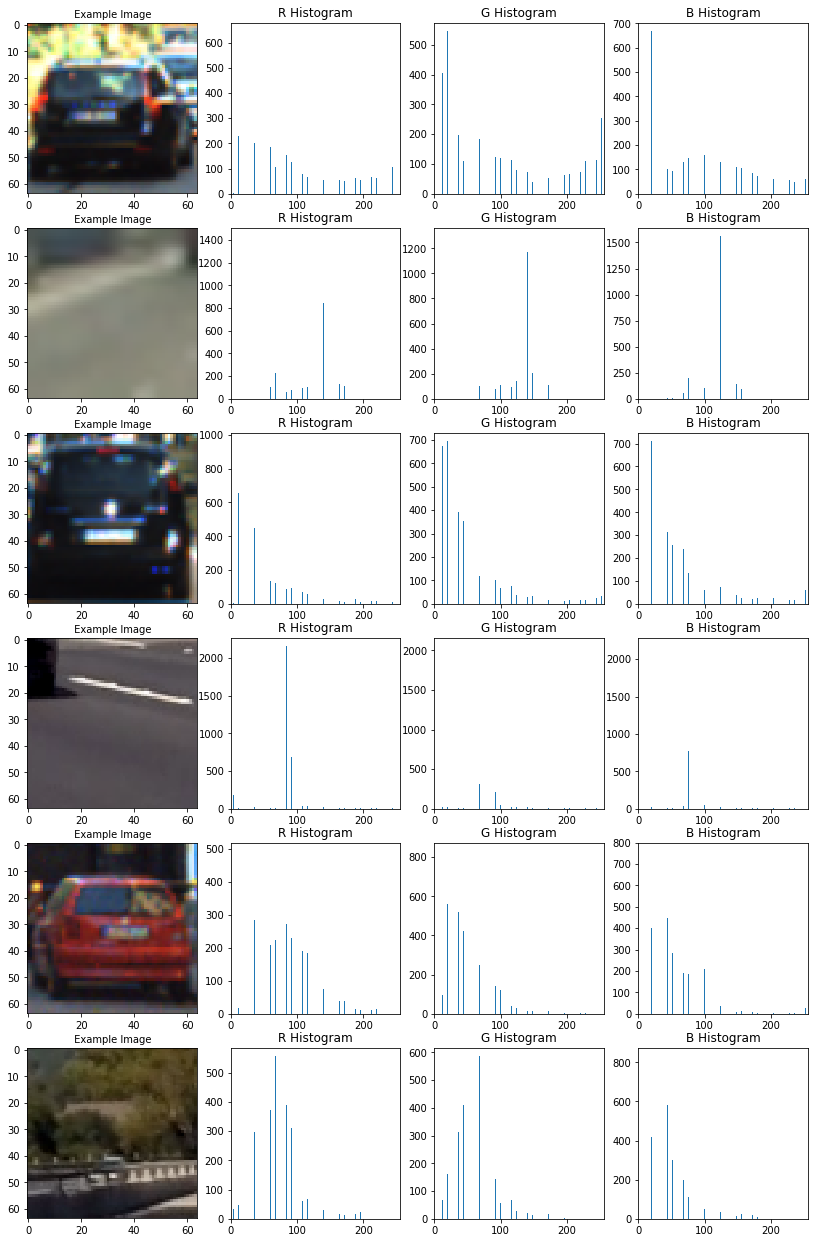
Exploration of different chanals for hist feature vecture
fig = plt.figure(figsize=(14,22))

count = 1
n1,n2 = 6,4
for k in range(6):

    if k%2 ==0:
        ind = np.random.randint(0, len(cars))
        Img = cv2.imread(cars[ind])

    else:
        ind = np.random.randint(0, len(notcars))
        Img = cv2.imread(notcars[ind])


    Img = cv2.cvtColor(Img, cv2.COLOR_BGR2RGB)

    ch1_hist,ch2_hist,ch3_hist, bincen, hist_features\
         = FE.color_hist(Img,plot_info=True)


    #fig-1
    fig.add_subplot(n1,n2,count)
    plt.imshow(Img)
    plt.title(' Example Image', fontsize=10)
    count += 1

    #fig-2
    fig.add_subplot(n1,n2,count)
    plt.bar(bincen,ch1_hist[0])
    plt.xlim(0, 256)
    plt.title('R Histogram')
    count += 1

    #fig-3
    fig.add_subplot(n1,n2,count)
    plt.bar(bincen,ch2_hist[0])
    plt.xlim(0, 256)
    plt.title('G Histogram')
    count += 1

    #fig-4
    fig.add_subplot(n1,n2,count)
    plt.bar(bincen,ch3_hist[0])
    plt.xlim(0, 256)
    plt.title('B Histogram')
    count += 1
Plot of concateneted hist feature vector
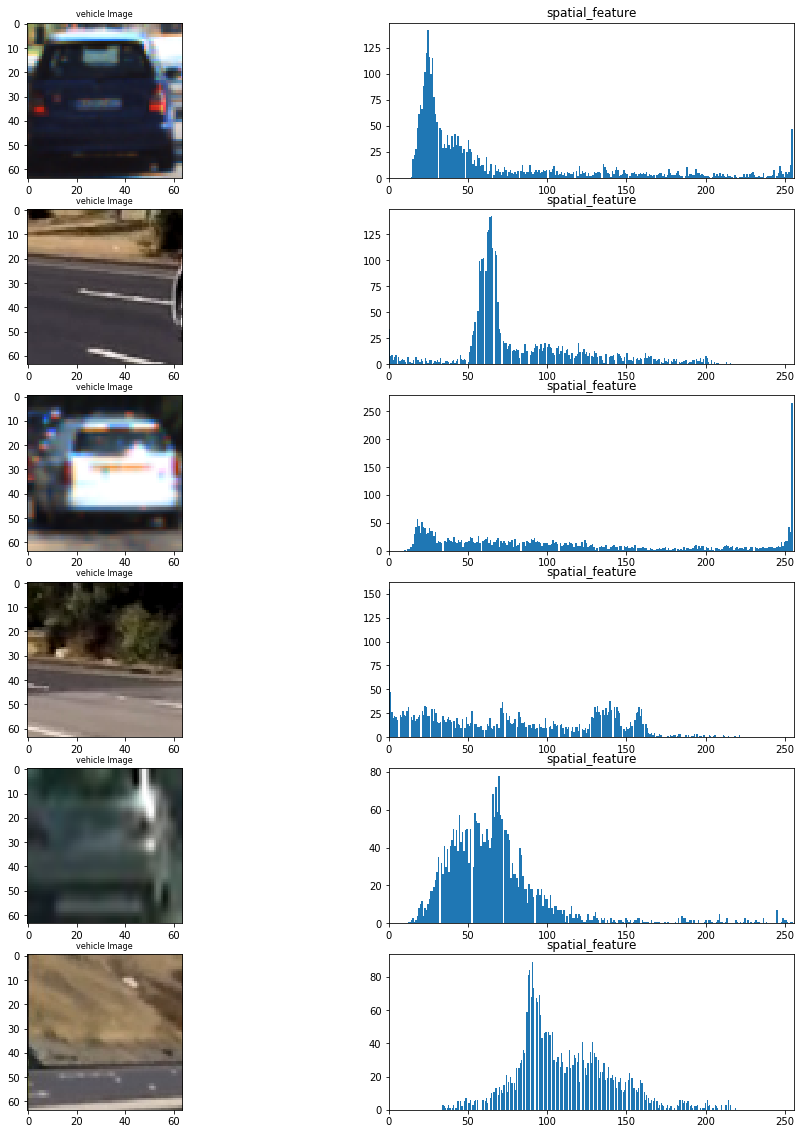
Exploring bin_spatial feature vectors
fig = plt.figure(figsize=(16,20))

count = 1
n1,n2 = 6,2
for k in range(6):

    if k%2 ==0:
        ind = np.random.randint(0, len(cars))
        Img = cv2.imread(cars[ind])

    else:
        ind = np.random.randint(0, len(notcars))
        Img = cv2.imread(notcars[ind])


    Img = cv2.cvtColor(Img, cv2.COLOR_BGR2RGB)

    features = FE.bin_spatial(Img)


    #fig-1
    fig.add_subplot(n1,n2,count)
    plt.imshow(Img)
    plt.title('vehicle Image', fontsize=8)
    count += 1


    #fig-5
    fig.add_subplot(6,2,count)
    plt.hist(features,bins=255)
    plt.xlim(0, 256)
    plt.title('spatial_feature')
    count += 1
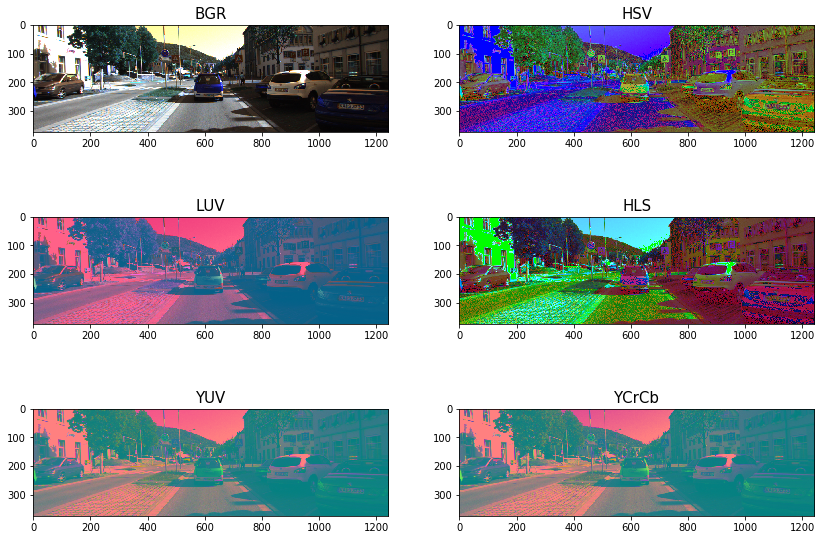
Exploration of color spaces
Img = cv2.imread("000275.png")
Img = cv2.cvtColor(Img, cv2.COLOR_BGR2RGB)

count = 1
n1,n2 = 3,2
convs = ['BGR','HSV','LUV','HLS','YUV','YCrCb']

fig = plt.figure(figsize=(14,10))

for  conv in convs:
    Img2 = FE.convert_color(Img, conv)

    #fig-1
    fig.add_subplot(n1,n2,count)
    plt.imshow(Img2)
    plt.title(conv, fontsize=15)
    count += 1
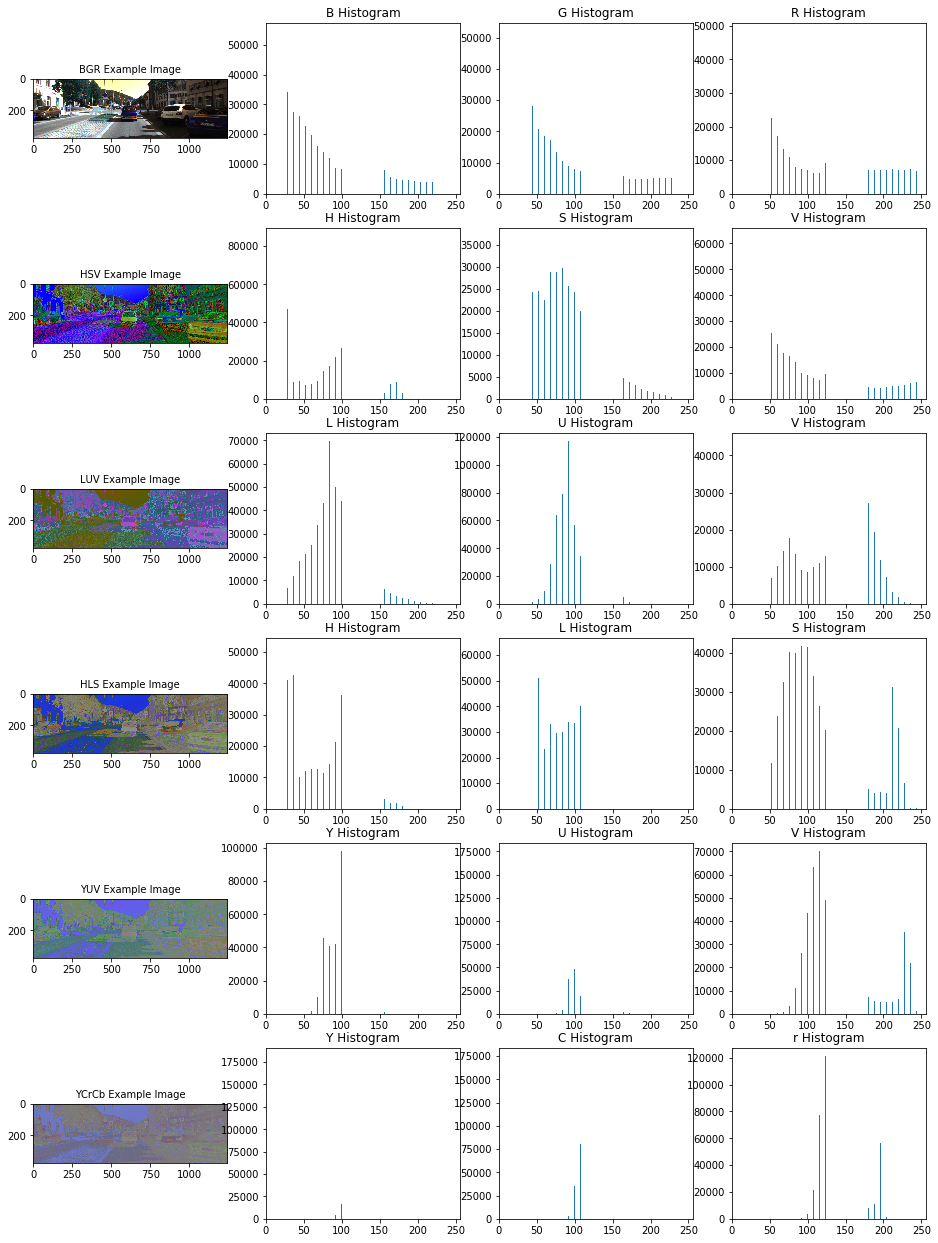
Img = cv2.imread("000275.png")
Img = cv2.cvtColor(Img, cv2.COLOR_BGR2RGB)

count = 1
n1,n2 = 6,4
convs = ['BGR','HSV','LUV','HLS','YUV','YCrCb']

fig = plt.figure(figsize=(16,22))

for  conv in convs:
    Img = FE.convert_color(Img, conv)

    ch1_hist,ch2_hist,ch3_hist, bincen, hist_features\
         = FE.color_hist(Img,plot_info=True)

    #fig-1
    fig.add_subplot(n1,n2,count)
    plt.imshow(Img)
    plt.title(conv+' Example Image', fontsize=10)
    count += 1

    #fig-2
    fig.add_subplot(n1,n2,count)
    plt.bar(bincen,ch1_hist[0])
    plt.xlim(0, 256)
    plt.title(conv[0]+' Histogram')
    count += 1

    #fig-3
    fig.add_subplot(n1,n2,count)
    plt.bar(bincen,ch2_hist[0])
    plt.xlim(0, 256)
    plt.title(conv[1]+' Histogram')
    count += 1

    #fig-4
    fig.add_subplot(n1,n2,count)
    plt.bar(bincen,ch3_hist[0])
    plt.xlim(0, 256)
    plt.title(conv[2]+' Histogram')
    count += 1
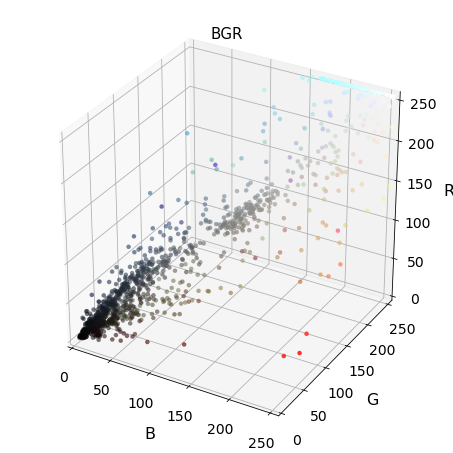
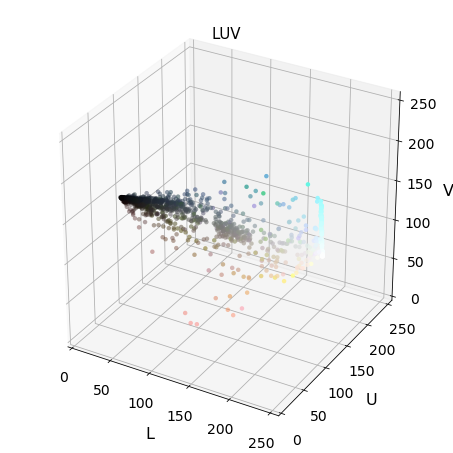
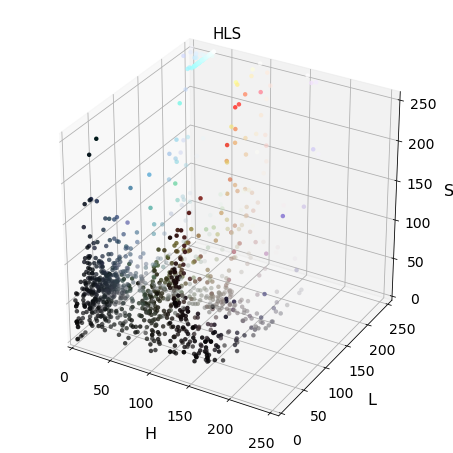
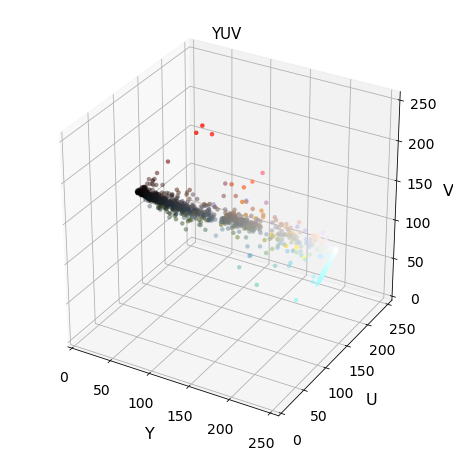
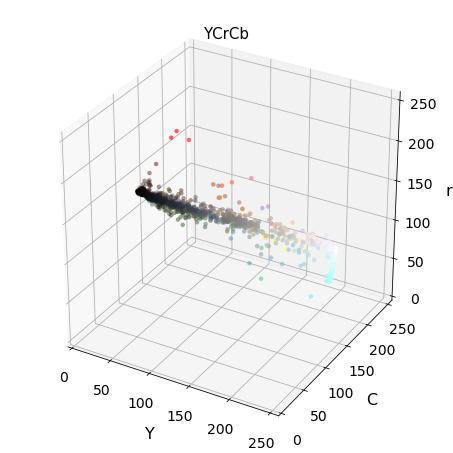
3-D plot of color space
def plot3d(pixels, colors_rgb,
        axis_labels=list("RGB"), axis_limits=[(0, 255), (0, 255), (0, 255)]):

    """Plot pixels in 3D."""

    # Create figure and 3D axes
    fig = plt.figure(figsize=(6, 6))
    ax = Axes3D(fig)

    # Set axis limits
    ax.set_xlim(*axis_limits[0])
    ax.set_ylim(*axis_limits[1])
    ax.set_zlim(*axis_limits[2])

    # Set axis labels and sizes
    ax.tick_params(axis='both', which='major', labelsize=14, pad=8)
    ax.set_xlabel(axis_labels[0], fontsize=16, labelpad=16)
    ax.set_ylabel(axis_labels[1], fontsize=16, labelpad=16)
    ax.set_zlabel(axis_labels[2], fontsize=16, labelpad=16)

    # Plot pixel values with colors given in colors_rgb
    ax.scatter(
        pixels[:, :, 0].ravel(),
        pixels[:, :, 1].ravel(),
        pixels[:, :, 2].ravel(),
        c=colors_rgb.reshape((-1, 3)), edgecolors='none')

    return ax  # return Axes3D object for further manipulation
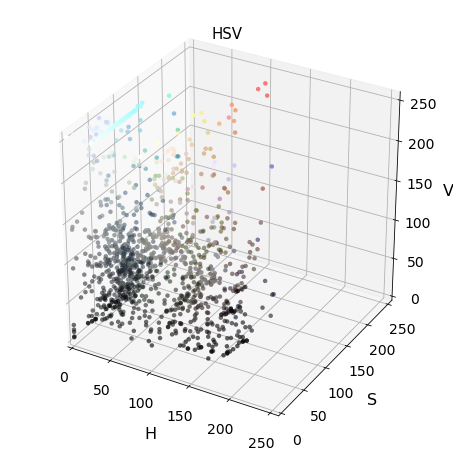
Exploring 3D color space
Img = cv2.imread("000275.png")
scale = max(Img.shape[0], Img.shape[1], 64) / 64  # at most 64 rows and columns
Img = cv2.resize(Img, (np.int(Img.shape[1] / scale),\
                             np.int(Img.shape[0] / scale)),\
                             interpolation=cv2.INTER_NEAREST)

Img_RGB = cv2.cvtColor(Img, cv2.COLOR_BGR2RGB)
img_small_rgb = Img_RGB / 255.

convs = ['BGR','HSV','LUV','HLS','YUV','YCrCb']

for  conv in convs:

    Img2 = FE.convert_color(Img, conv)

    #fig-1
    plot3d(Img2, img_small_rgb,axis_labels=list(conv))
    plt.title(conv, fontsize=15)
    plt.show()
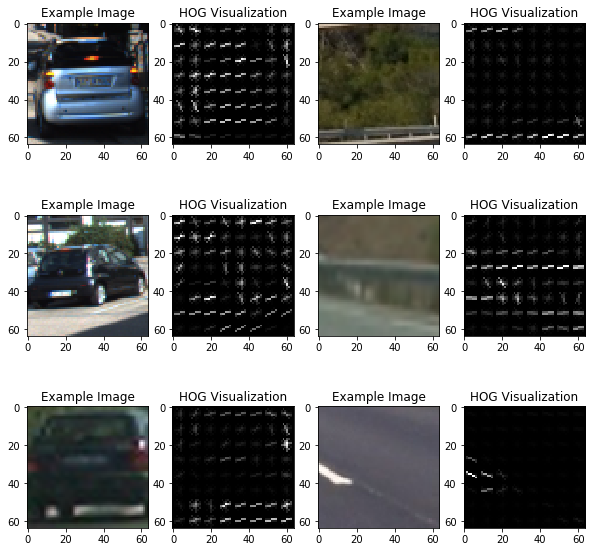
Hog feature visualizations
fig = plt.figure(figsize=(10,10))

count = 1
for k in range (6):

    # Generate a random index to look at a car image
    if k%2 ==0:
        ind = np.random.randint(0, len(cars))
        Img = mpimg.imread(cars[ind])
    else:

        ind = np.random.randint(0, len(notcars))
        Img = mpimg.imread(notcars[ind])

    gray = cv2.cvtColor(Img, cv2.COLOR_RGB2GRAY)

    features, hog_image = FE.get_hog_features(gray,vis=True, feature_vec=True)


    #fig-1
    fig.add_subplot(3,4,count)
    plt.imshow(Img)
    plt.title('Example Image')
    count += 1


    #fig-1
    fig.add_subplot(3,4,count)
    plt.imshow(hog_image,cmap='gray')
    plt.title('HOG Visualization')
    count += 1
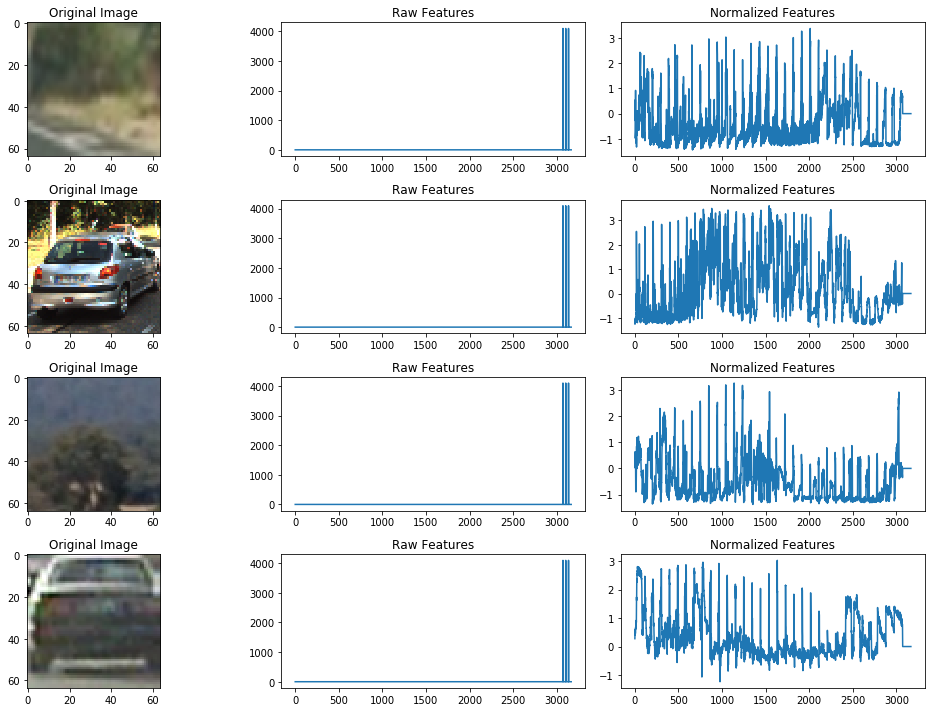
Application of feature Normalization
X_car = FE.extract_color_features(cars,cspace=colorspace)
X_notcar = FE.extract_color_features(notcars, cspace=colorspace)
X = np.vstack((X_car,X_notcar)).astype(np.float64)
X_scaler = StandardScaler().fit(X)
# Apply the scaler to X
scaled_X = X_scaler.transform(X)
fig = plt.figure(figsize=(14,10))
count = 1
for k in range (1,5):
    # Generate a random index to look at a car image
    if k%2 ==0:
        ind = np.random.randint(0, len(cars))
        Img = mpimg.imread(cars[ind])

    else:
        ind = np.random.randint(0, len(notcars))
        Img = mpimg.imread(notcars[ind])

    plt.subplot(4,3,count)
    plt.imshow(Img)
    plt.title('Original Image')
    count += 1

    plt.subplot(4,3,count)
    plt.plot(X[ind])
    plt.title('Raw Features')
    count += 1

    plt.subplot(4,3,count)
    plt.plot(scaled_X[ind])
    plt.title('Normalized Features')
    count += 1

    fig.tight_layout()
Classifier
Extraction of all required features
# Reduce the sample size because HOG features are slow to compute
# The quiz evaluator times out after 13s of CPU time
#sample_size = 500
#cars = cars[0:sample_size]
#notcars = notcars[0:sample_size]


### TODO: Tweak these parameters and see how the results change.
colorspace = 'YCrCb'  #'RGB' # Can be RGB, HSV, LUV, HLS, YUV, YCrCb
orient = 9
pix_per_cell = 8
cell_per_block = 2
hog_channel = "ALL" # Can be 0, 1, 2, or "ALL"
hist_bins = 32
hist_bins_range = (0,256)
spatial_size = (32,32)


t=time.time()

FE = FeatureExtraction(hist_bins = hist_bins,\
                            hist_bins_range =  hist_bins_range,\
                            spatial_size = spatial_size,\
                            orient = orient,\
                            pix_per_cell =  pix_per_cell,\
                            cell_per_block =  cell_per_block)


color_car_features = FE.extract_color_features(cars,
                                               cspace=colorspace)
color_notcar_features = FE.extract_color_features(notcars,
                                                cspace=colorspace)

hog_car_features = FE.extract_hog_features(cars,
                                    cspace=colorspace,
                                    hog_channel=hog_channel)

hog_notcar_features = FE.extract_hog_features(notcars,
                                       cspace=colorspace,
                                       hog_channel=hog_channel)

t2 = time.time()

print(round(t2-t, 2), 'Seconds to extract HOG features...')
232.56 Seconds to extract HOG features...
Stacking all feature to single vector
# Create an array stack of feature vectors
X_car = np.hstack((color_car_features,hog_car_features)).astype(np.float64)
X_notcar = np.hstack((color_notcar_features, hog_notcar_features)).astype(np.float64)
X = np.vstack((X_car,X_notcar)).astype(np.float64)

X_scaler = StandardScaler().fit(X)

# Apply the scaler to X
scaled_X = X_scaler.transform(X)

# Define the labels vector
y = np.hstack((np.ones(len(hog_car_features)), np.zeros(len(hog_notcar_features))))
Train and test split
from sklearn.utils import shuffle

scaled_X, y = shuffle(scaled_X, y )

# Split up data into randomized training and test sets
rand_state = np.random.randint(0, 100)
X_train, X_test, y_train, y_test = train_test_split(
    scaled_X, y, test_size=0.2, random_state=rand_state)

print('Using:',orient,'orientations',pix_per_cell,
    'pixels per cell and', cell_per_block,'cells per block')
print('Feature vector length:', len(X_train[0]))
Using: 9 orientations 8 pixels per cell and 2 cells per block
Feature vector length: 8460
Training Linear SVC
# Use a linear SVC
svc = LinearSVC()
# Check the training time for the SVC


t=time.time()
svc.fit(X_train, y_train)
t2 = time.time()
print(round(t2-t, 2), 'Seconds to train SVC...')
# Check the score of the SVC
print('Test Accuracy of SVC = ', round(svc.score(X_test, y_test), 4))
# Check the prediction time for a single sample
t=time.time()


n_predict = 10
print('My SVC predicts: ', svc.predict(X_test[0:n_predict]))
print('For these',n_predict, 'labels: ', y_test[0:n_predict])
t2 = time.time()
print(round(t2-t, 5), 'Seconds to predict', n_predict,'labels with SVC')
392.39 Seconds to train SVC...
Test Accuracy of SVC =  0.9904
My SVC predicts:  [ 1.  0.  0.  0.  0.  1.  0.  0.  1.  0.]
For these 10 labels:  [ 1.  0.  0.  0.  0.  1.  0.  0.  1.  0.]
2.42908 Seconds to predict 10 labels with SVC
Saving model for later use
import pickle as pickle
dist_pickle = {}
dist_pickle["svc"] = svc
dist_pickle["scaler"] = X_scaler
dist_pickle["orient"] = orient
dist_pickle["pix_per_cell"]= pix_per_cell
dist_pickle["cell_per_block"]= cell_per_block
dist_pickle["spatial_size"]= spatial_size
dist_pickle["hist_bins"]= hist_bins

with open('svc_pickle.p', mode='wb') as f:
    pickle.dump(dist_pickle, f)
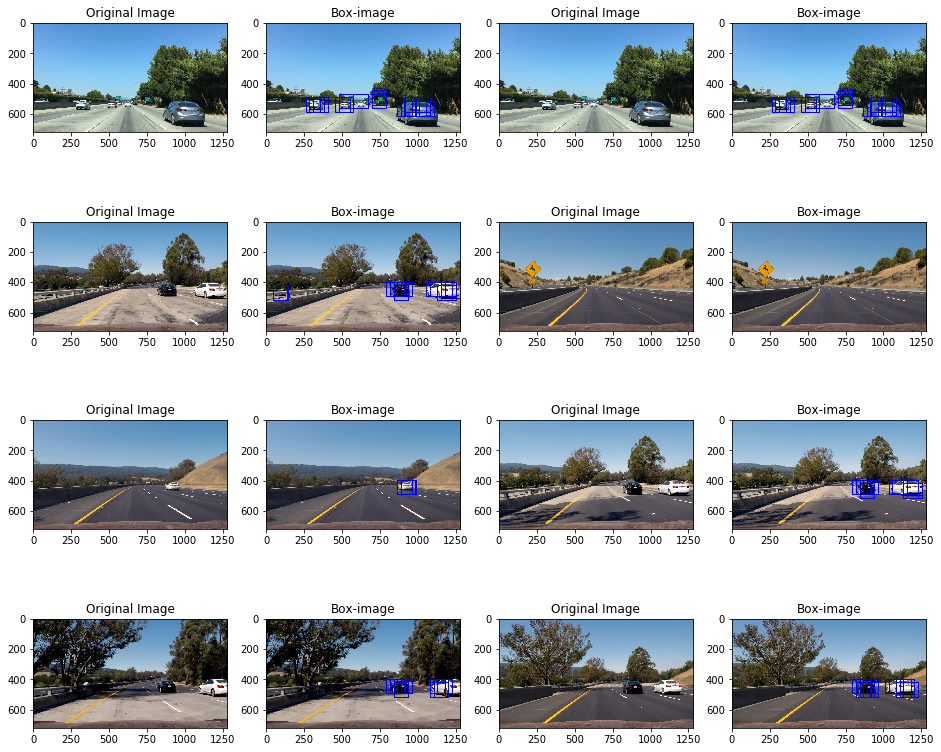
Applying classifier to an image
def find_cars(img, ystart, ystop, scale, svc,\
              X_scaler, color_space, orient,\
              pix_per_cell, cell_per_block,\
              hog_channel,spatial_size, hist_bins):


    FE = FeatureExtraction(hist_bins = hist_bins,\
                            hist_bins_range =  hist_bins_range,\
                            spatial_size = spatial_size,\
                            orient = orient,\
                            pix_per_cell =  pix_per_cell,\
                            cell_per_block =  cell_per_block)


    draw_img = np.copy(img)
    img = img.astype(np.float32) / 255

    img_tosearch = img[ystart:ystop, :, :]
    ctrans_tosearch = FE.convert_color(img_tosearch, color_space)
    if scale != 1:
        imshape = ctrans_tosearch.shape
        ctrans_tosearch = cv2.resize(ctrans_tosearch,\
                        (np.int(imshape[1] / scale), np.int(imshape[0] / scale)))

    ch1 = ctrans_tosearch[:, :, 0]
    ch2 = ctrans_tosearch[:, :, 1]
    ch3 = ctrans_tosearch[:, :, 2]

    # Define blocks and steps as above
    nxblocks = (ch1.shape[1] // pix_per_cell) - 1
    nyblocks = (ch1.shape[0] // pix_per_cell) - 1
    nfeat_per_block = orient * cell_per_block ** 2
    # 64 was the orginal sampling rate, with 8 cells and 8 pix per cell
    window = 64
    nblocks_per_window = (window // pix_per_cell) - 1
    cells_per_step = 2  # Instead of overlap, define how many cells to step
    nxsteps = (nxblocks - nblocks_per_window) // cells_per_step
    nysteps = (nyblocks - nblocks_per_window) // cells_per_step

    # Compute individual channel HOG features for the entire image
    if hog_channel == 'ALL':
        hog1 = FE.get_hog_features(ch1,vis = False, feature_vec=False)
        hog2 = FE.get_hog_features(ch2,vis = False, feature_vec=False)
        hog3 = FE.get_hog_features(ch3,vis = False, feature_vec=False)
    else:
        hog1 = FE.get_hog_features(hog_channel,vis =False, feature_vec=False)

    for xb in range(nxsteps):
        for yb in range(nysteps):
            ypos = yb * cells_per_step
            xpos = xb * cells_per_step
            # Extract HOG for this patch

            if hog_channel == 'ALL':
                hog_feat1 = hog1[ypos:ypos + nblocks_per_window,\
                                 xpos:xpos + nblocks_per_window].ravel()
                hog_feat2 = hog2[ypos:ypos + nblocks_per_window,\
                                 xpos:xpos + nblocks_per_window].ravel()
                hog_feat3 = hog3[ypos:ypos + nblocks_per_window,\
                                 xpos:xpos + nblocks_per_window].ravel()

                hog_features = np.hstack((hog_feat1, hog_feat2, hog_feat3))
            else:
                hog_features = hog1[ypos:ypos + nblocks_per_window,\
                                    xpos:xpos + nblocks_per_window].ravel()

            xleft = xpos * pix_per_cell
            ytop = ypos * pix_per_cell

            # Extract the image patch
            subimg = cv2.resize(ctrans_tosearch[ytop:ytop +\
                                window, xleft:xleft + window], (64, 64))

            # Get color features
            spatial_features = FE.bin_spatial(subimg)
            hist_features = FE.color_hist(subimg)

            # Scale features and make a prediction
            test_features = X_scaler.transform(
                np.hstack((spatial_features, hist_features, hog_features)).reshape(1, -1))
            # test_features = X_scaler.transform(np.hstack((shape_feat, hist_feat)).reshape(1, -1))
            test_prediction = svc.predict(test_features)

            if test_prediction == 1:
                xbox_left = np.int(xleft * scale)
                ytop_draw = np.int(ytop * scale)
                win_draw = np.int(window * scale)
                cv2.rectangle(draw_img, (xbox_left, ytop_draw + ystart),
                              (xbox_left + win_draw, ytop_draw + win_draw + ystart), (0, 0, 255), 6)

    return draw_img
directory = 'test_images/*.jpg'
globDir = glob.glob(directory)
fig = plt.figure(figsize=(16,14))

n1 = 4
n2 = 4
color_space='YCrCb'
ystart = 400
ystop = 656
scale = 1.5

count = 1
for k,img in enumerate(globDir):
    Img = mpimg.imread(img)

    out_img = find_cars(Img, ystart, ystop, scale,\
                    svc, X_scaler, color_space,\
                    orient, pix_per_cell, cell_per_block,\
                    hog_channel, spatial_size, hist_bins)

    #fig-1
    fig.add_subplot(n1,n2,count)
    plt.imshow(Img)
    plt.title('Original Image')
    count += 1


     #fig-2
    fig.add_subplot(n1,n2,count)
    plt.imshow(out_img)
    plt.title('Box-image')
    count += 1
Utilities
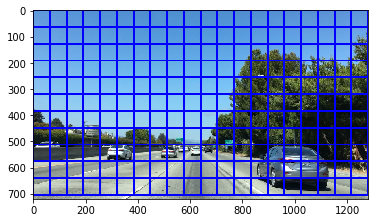
Sliding window
def slide_window(img, x_start_stop=[None, None],\
                      y_start_stop=[None, None],\
                      xy_window=(64, 64),\
                      xy_overlap=(0.5, 0.5)):


    # If x and/or y start/stop positions not defined, set to image size
    if x_start_stop[0] == None:
        x_start_stop[0] = 0
    if x_start_stop[1] == None:
        x_start_stop[1] = img.shape[1]
    if y_start_stop[0] == None:
        y_start_stop[0] = 0
    if y_start_stop[1] == None:
        y_start_stop[1] = img.shape[0]

    # Compute the span of the region to be searched
    xspan = x_start_stop[1] - x_start_stop[0]
    yspan = y_start_stop[1] - y_start_stop[0]

    # Compute the number of pixels per step in x/y
    nx_pix_per_step = np.int(xy_window[0]*(1 - xy_overlap[0]))
    ny_pix_per_step = np.int(xy_window[1]*(1 - xy_overlap[1]))

    # Compute the number of windows in x/y
    nx_buffer = np.int(xy_window[0]*(xy_overlap[0]))
    ny_buffer = np.int(xy_window[1]*(xy_overlap[1]))
    nx_windows = np.int((xspan-nx_buffer)/nx_pix_per_step)
    ny_windows = np.int((yspan-ny_buffer)/ny_pix_per_step)

    # Initialize a list to append window positions to
    window_list = []
    # Loop through finding x and y window positions
    # Note: you could vectorize this step, but in practice
    # you'll be considering windows one by one with your
    # classifier, so looping makes sense
    for ys in range(ny_windows):
        for xs in range(nx_windows):
            # Calculate window position
            startx = xs*nx_pix_per_step + x_start_stop[0]
            endx = startx + xy_window[0]
            starty = ys*ny_pix_per_step + y_start_stop[0]
            endy = starty + xy_window[1]
            # Append window position to list
            window_list.append(((startx, starty), (endx, endy)))
    # Return the list of windows
    return window_list
image = mpimg.imread('car.jpg')
windows = slide_window(image, x_start_stop=[None, None], y_start_stop=[None, None],
                    xy_window=(128, 128), xy_overlap=(0.5, 0.5))

window_img = draw_boxes(image, windows, color=(0, 0, 255), thick=6)
plt.imshow(window_img)
<matplotlib.image.AxesImage at 0x1239f9a58>
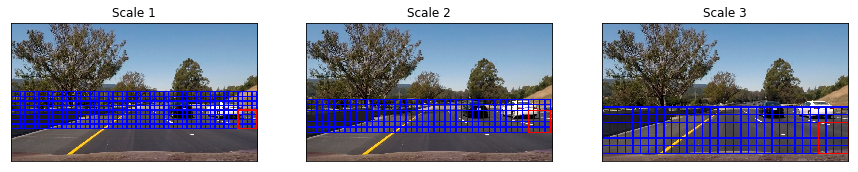
Multi scale window
def draw_multi_scale_windows(img, ystart, ystop, scale):
    draw_img = np.copy(img)
    img = img.astype(np.float32) / 255

    img_tosearch = img[ystart:ystop, :, :]
    imshape = img_tosearch.shape

    img_tosearch = cv2.resize(img_tosearch,\
                              (np.int(imshape[1] / scale),\
                               np.int(imshape[0] / scale)))

    # Define blocks and steps as above
    nxblocks = (img_tosearch.shape[1] // pix_per_cell) - 1
    nyblocks = (img_tosearch.shape[0] // pix_per_cell) - 1
    nfeat_per_block = orient * cell_per_block ** 2

    window = 64
    nblocks_per_window = (window // pix_per_cell) - 1
    cells_per_step = 2  # Instead of overlap, define how many cells to step
    nxsteps = (nxblocks - nblocks_per_window) // cells_per_step
    nysteps = (nyblocks - nblocks_per_window) // cells_per_step

    rect_start = None
    rect_end = None
    for xb in range(nxsteps+1):
        for yb in range(nysteps+1):
            ypos = yb * cells_per_step
            xpos = xb * cells_per_step

            xleft = xpos * pix_per_cell
            ytop = ypos * pix_per_cell

            xbox_left = np.int(xleft * scale)
            ytop_draw = np.int(ytop * scale)
            win_draw = np.int(window * scale)
            rect_start = (xbox_left, ytop_draw + ystart)
            rect_end = (xbox_left + win_draw, ytop_draw + win_draw + ystart)
            cv2.rectangle(draw_img, rect_start, rect_end, (0, 0, 255), 6)

    cv2.rectangle(draw_img, rect_start, rect_end, (255, 0, 0), 6)

    return draw_img
img = mpimg.imread('test_images/test6.jpg')

plt.figure(figsize=(15,10))
subpltcount=1
for (ystart, ystop, scale) in [(360, 560, 1.5), (400, 600, 1.8), (440, 700, 2.5)]:

    plt.subplot(1,3,subpltcount)
    plt.imshow(draw_multi_scale_windows(img, ystart, ystop, scale))
    plt.title('Scale %s'%subpltcount)
    plt.xticks([])
    plt.yticks([])
    subpltcount +=1
Vehicle Detecton Pipeline
class DetectVehicle(object):


    def __init__(self,param_dict):
        self.param_dict = param_dict
        self.svc = self.param_dict['svc']
        self.X_scalar = self.param_dict['X_scalar']
        self.orient = self.param_dict['orient']
        self.pix_per_cell = self.param_dict['pix_per_cell']
        self.cell_per_block = self.param_dict['cell_per_block']
        self.hist_bins = self.param_dict['hist_bins']
        self.spatial_size = self.param_dict['spatial_size']


        self.FE = FeatureExtraction(hist_bins = self.hist_bins,\
                            hist_bins_range =  (0,256),\
                            spatial_size = self.spatial_size,\
                            orient = self.orient,\
                            pix_per_cell =  self.pix_per_cell,\
                            cell_per_block =  self.cell_per_block)


        self.threshold = 1.0
        self.heatmap = None

        # Heat Image for the Last Three Frames
        self.heat_images = deque(maxlen=3)

        # Current Frame Count
        self.frame_count = 0
        self.full_frame_processing_interval = 4

        # Xstart
        self.xstart = 600


        # Various Scales
        self.ystart_ystop_scale = [(360, 560, 1.5), (400, 600, 1.8), (440, 700, 2.5)]


        # Kernal For Dilation
        self.kernel = np.ones((50, 50))

        self.image = None


    def find_cars(self,image,vid=True,vis=False):
        self.image = image
        box_list = []
        draw_img = np.copy(self.image)
        img = self.image.astype(np.float32)/255

        if vid: # video

            if self.frame_count % self.full_frame_processing_interval == 0:
                mask = np.ones_like(img[:, :, 0])
            else:
                mask = np.sum(np.array(self.heat_images), axis=0)
                mask[(mask > 0)] = 1
                mask = cv2.dilate(mask, self.kernel, iterations=1)

            self.frame_count += 1

            for (self.ystart, self.ystop, self.scale) in self.ystart_ystop_scale:

                nonzero = mask.nonzero()
                nonzeroy = np.array(nonzero[0])
                nonzerox = np.array(nonzero[1])

                if len(nonzeroy) != 0:
                    self.ystart = max(np.min(nonzeroy), self.ystart)
                    self.ystop = min(np.max(nonzeroy), self.ystop)
                if len(nonzeroy) != 0:
                    x_start = max(np.min(nonzerox), self.xstart)
                    x_stop = np.max(nonzerox)
                else:
                    continue

                if x_stop <= x_start or self.ystop <= self.ystart:
                    continue

                ibox_list = self.window_search(img)
                for k in range(len(ibox_list)):
                    box_list.append(ibox_list[k])

            # Add heat to each box in box list
            self.add_heat_and_threshold(draw_img, box_list)
            # Find final boxes from heatmap using label function
            labels = label(self.heatmap)
            draw_img = self.draw_labeled_bboxes(draw_img, labels)

            return draw_img


        else: # picture

            for (self.ystart, self.ystop, self.scale) in self.ystart_ystop_scale:
                ibox_list = self.window_search(img)

                for k in range(len(ibox_list)):
                    box_list.append(ibox_list[k])

            if vis: # visualize picture with all boaxes found
                return box_list

            else: # visualize only threshold boxes
                draw_image = self.window_search(img)
                # Add heat to each box in box list
                self.add_heat_and_threshold(draw_img, box_list)
                # Find final boxes from heatmap using label function
                labels = label(self.heatmap)
                draw_img = self.draw_labeled_bboxes(draw_img, labels)

                return [draw_img,self.heatmap]


    def window_search(self,img):

            box_list = []
            img_tosearch = img[self.ystart:self.ystop,:,:]
            ctrans_tosearch = FE.convert_color(img_tosearch, cspace='YCrCb')

            if self.scale != 1:
                imshape = ctrans_tosearch.shape
                ctrans_tosearch = cv2.resize(ctrans_tosearch,
                                     (np.int(imshape[1]/self.scale),
                                      np.int(imshape[0]/self.scale)))

            ch1 = ctrans_tosearch[:,:,0]
            ch2 = ctrans_tosearch[:,:,1]
            ch3 = ctrans_tosearch[:,:,2]


            # Define blocks and steps as above
            nxblocks = (ch1.shape[1] // self.pix_per_cell) - self.cell_per_block + 1
            nyblocks = (ch1.shape[0] // self.pix_per_cell) - self.cell_per_block + 1
            nfeat_per_block = self.orient*self.cell_per_block**2

            # 64 was the orginal sampling rate, with 8 cells and 8 pix per cell
            window = 64
            nblocks_per_window = (window // self.pix_per_cell) - self.cell_per_block + 1
            cells_per_step = 2  # Instead of overlap, define how many cells to step
            nxsteps = (nxblocks - nblocks_per_window) // cells_per_step
            nysteps = (nyblocks - nblocks_per_window) // cells_per_step

            # Compute individual channel HOG features for the entire image

            hog1 = FE.get_hog_features(ch1,vis=False,feature_vec = False)
            hog2 = FE.get_hog_features(ch2,vis=False,feature_vec = False)
            hog3 = FE.get_hog_features(ch3,vis=False,feature_vec = False)


            for xb in range(nxsteps):
                for yb in range(nysteps):
                    ypos = yb*cells_per_step
                    xpos = xb*cells_per_step
                    # Extract HOG for this patch
                    hog_feat1 = hog1[ypos:ypos+nblocks_per_window,
                             xpos:xpos+nblocks_per_window].ravel()
                    hog_feat2 = hog2[ypos:ypos+nblocks_per_window,
                             xpos:xpos+nblocks_per_window].ravel()
                    hog_feat3 = hog3[ypos:ypos+nblocks_per_window,
                             xpos:xpos+nblocks_per_window].ravel()

                    hog_features = np.hstack((hog_feat1, hog_feat2, hog_feat3))

                    xleft = xpos*self.pix_per_cell
                    ytop = ypos*self.pix_per_cell

                    # Extract the image patch
                    subimg = cv2.resize(ctrans_tosearch[ytop:ytop+window,\
                                                    xleft:xleft+window], (64,64))

                    # Get color features
                    spatial_features = self.FE.bin_spatial(subimg)
                    hist_features = self.FE.color_hist(subimg)

                    color_features = np.hstack((spatial_features, hist_features))

                    X = np.hstack((color_features,hog_features)).reshape(1, -1)

                    test_features = X_scaler.transform(X)

                    test_prediction = self.svc.predict(test_features)


                    if test_prediction == 1:

                        xbox_left = np.int(xleft*self.scale)
                        ytop_draw = np.int(ytop*self.scale)
                        win_draw = np.int(window*self.scale)

                        box_list.append(((xbox_left, ytop_draw + self.ystart),\
                                     (xbox_left + win_draw, ytop_draw + \
                                      win_draw + self.ystart)))


            return box_list


    def add_heat_and_threshold(self,draw_img, bbox_list):
        # Iterate through list of bboxes
        h_map = np.zeros_like(draw_img[:,:,0]).astype(np.float)

        for box in bbox_list:
            # Add += 1 for all pixels inside each bbox
            # Assuming each "box" takes the form ((x1, y1), (x2, y2))
            h_map[box[0][1]:box[1][1], box[0][0]:box[1][0]] += 1

        self.heat_images.append(h_map)
        self.heatmap = np.sum(np.array(self.heat_images),axis=0)
        # Return thresholded map
        self.heatmap[self.heatmap <= self.threshold] = 0
        # Return updated heatmap
        return


    def draw_labeled_bboxes(self,img, labels):
        # Iterate through all detected cars
        for car_number in range(1, labels[1]+1):
            # Find pixels with each car_number label value
            nonzero = (labels[0] == car_number).nonzero()
            # Identify x and y values of those pixels
            nonzeroy = np.array(nonzero[0])
            nonzerox = np.array(nonzero[1])
            # Define a bounding box based on min/max x and y
            bbox = ((np.min(nonzerox), np.min(nonzeroy)),\
                    (np.max(nonzerox), np.max(nonzeroy)))
            # Draw the box on the image
            cv2.rectangle(img, bbox[0], bbox[1], (0,0,255), 6)
        # Return the image
        return img
Application of sliding window search
Parameter setting
dist_pickle = pickle.load( open("svc_pickle.p", "rb" ) )
param_dict = {}

param_dict['ystart']  = 400
param_dict['ystop']  = 656
param_dict['scale'] = 1.5
param_dict['svc']  =  dist_pickle["svc"]
param_dict['X_scalar'] = dist_pickle["scaler"]
param_dict['orient'] = dist_pickle["orient"]
param_dict['pix_per_cell'] = dist_pickle["pix_per_cell"]
param_dict['cell_per_block']  = dist_pickle["cell_per_block"]
param_dict['spatial_size'] = (32,32)
param_dict['hist_bins'] = 32
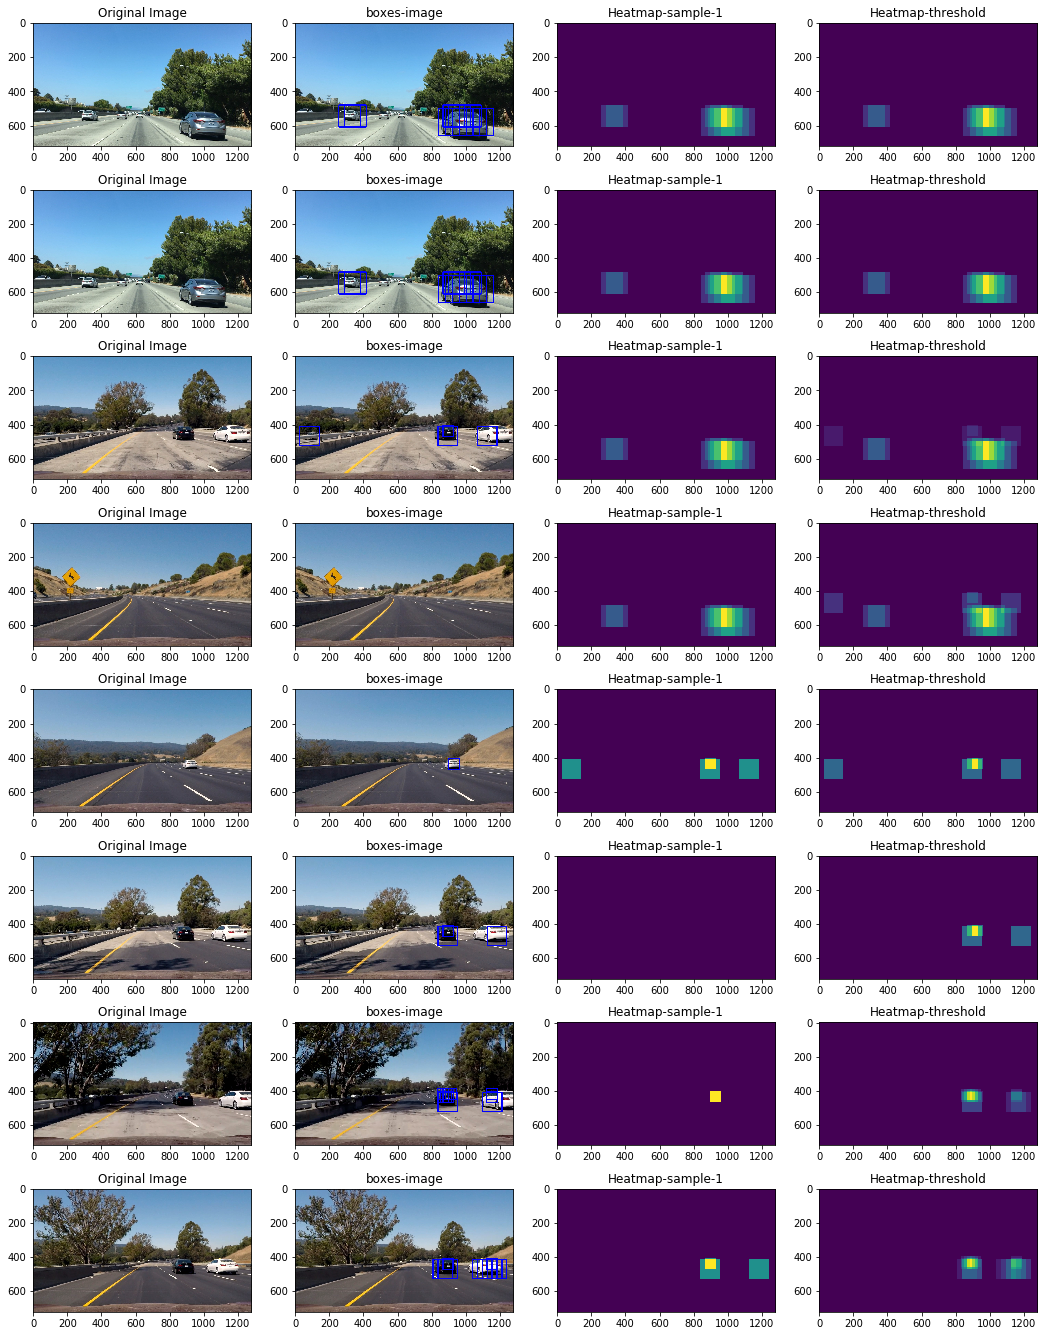
directory = 'test_images/*.jpg'
globDir = glob.glob(directory)
fig = plt.figure(figsize=(18,24))
DV = DetectVehicle(param_dict)
n1 = 8
n2 = 4

count = 1
for k,img in enumerate(globDir):
    Img = mpimg.imread(img)
    boxes = DV.find_cars(Img,vid=False,vis=True)
    [draw_img_,heatmap] = DV.find_cars(Img,vid=False,vis=False)

    #fig-1
    fig.add_subplot(n1,n2,count)
    plt.imshow(Img)
    plt.title('Original Image')
    count += 1

    #fig-2
    fig.add_subplot(n1,n2,count)
    box_Img = draw_boxes(Img, boxes)
    plt.imshow(box_Img)
    plt.title('boxes-image')
    count += 1

    #fig-3
    fig.add_subplot(n1,n2,count)
    plt.imshow(DV.heat_images[0])
    plt.title('Heatmap-sample-1')
    count += 1


     #fig-5
    fig.add_subplot(n1,n2,count)
    plt.imshow(DV.heatmap)
    plt.title('Heatmap-threshold')
    count += 1
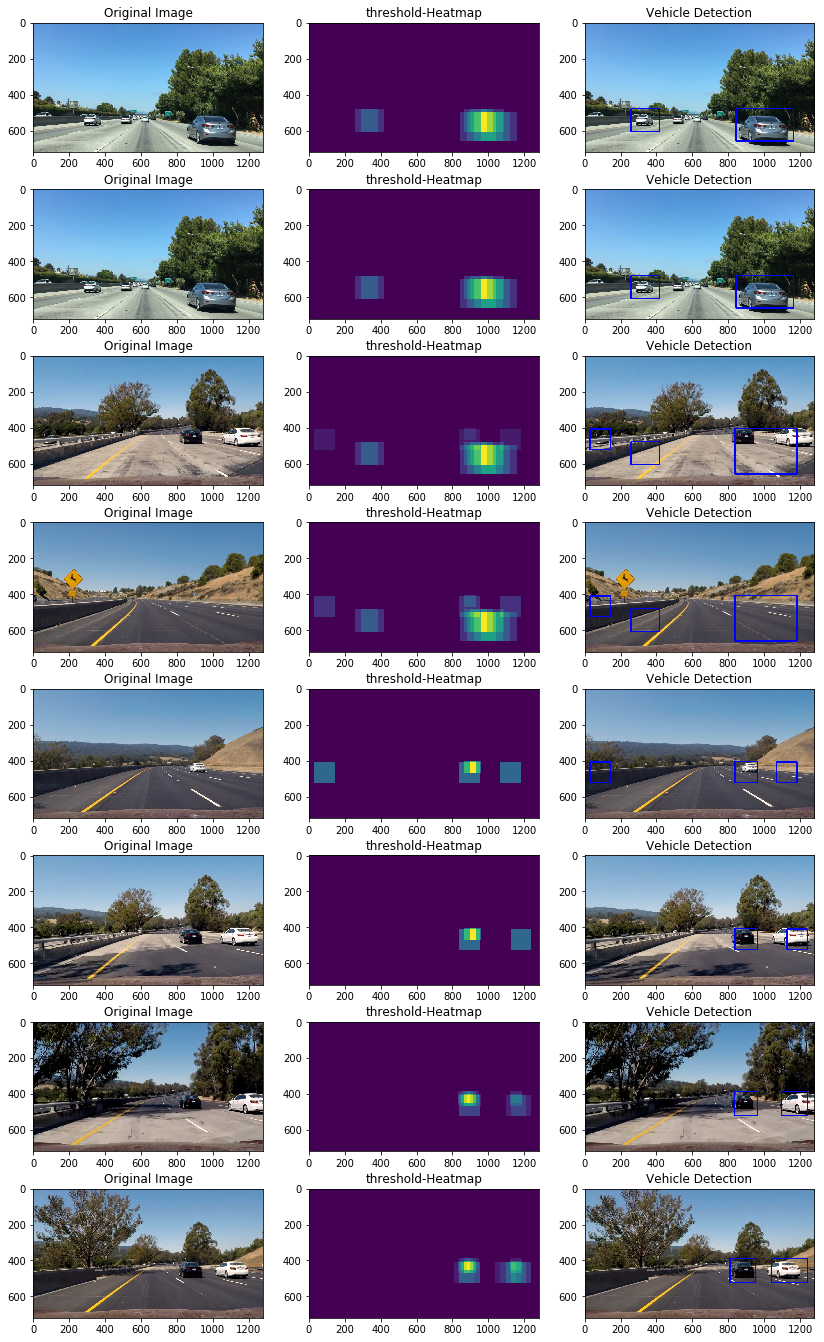
directory = 'test_images/*.jpg'
globDir = glob.glob(directory)
fig = plt.figure(figsize=(14,24))
DV = DetectVehicle(param_dict)

count = 1
for k,img in enumerate(globDir):
    Img = mpimg.imread(img)
    [draw_img,heatmap] = DV.find_cars(Img,vid=False,vis=False)

    #fig-1
    fig.add_subplot(8,3,count)
    plt.imshow(Img)
    plt.title('Original Image')
    count += 1

    #fig-2
    fig.add_subplot(8,3,count)
    plt.imshow(heatmap)
    plt.title('threshold-Heatmap')
    count += 1

    #fig-3
    fig.add_subplot(8,3,count)
    plt.imshow(draw_img)
    plt.title('Vehicle Detection')
    count += 1
Video Detector
dist_pickle = pickle.load( open("svc_pickle.p", "rb" ) )
param_dict = {}
param_dict['ystart']  = 400
param_dict['ystop']  = 656
param_dict['scale'] = 1.5
param_dict['svc']  =  dist_pickle["svc"]
param_dict['X_scalar'] = dist_pickle["scaler"]
param_dict['orient'] = dist_pickle["orient"]
param_dict['pix_per_cell'] = dist_pickle["pix_per_cell"]
param_dict['cell_per_block']  = dist_pickle["cell_per_block"]
param_dict['spatial_size'] = (32,32)
param_dict['hist_bins'] = 32
# Read in image similar to one shown above

DV = DetectVehicle(param_dict)
white_output = 'test_video_output.mp4'
clip = VideoFileClip("test_video.mp4")#.subclip(t_start=30,t_end=35)
white_clip = clip.fl_image(DV.find_cars)
%time white_clip.write_videofile(white_output, audio=False)

HTML("""
<video width="960" height="540" controls>
  <source src="{0}">
</video>
""".format(white_output))
[MoviePy] >>>> Building video test_video_output.mp4
[MoviePy] Writing video test_video_output.mp4


 97%|█████████▋| 38/39 [00:21<00:00,  1.64it/s]


[MoviePy] Done.
[MoviePy] >>>> Video ready: test_video_output.mp4

CPU times: user 19.3 s, sys: 1.79 s, total: 21.1 s
Wall time: 22.2 s
white_output = 'project_video_output.mp4'
clip = VideoFileClip("project_video.mp4")#.subclip(t_start=30,t_end=35)
white_clip = clip.fl_image(DV.find_cars)
%time white_clip.write_videofile(white_output, audio=False)

HTML("""
<video width="960" height="540" controls>
  <source src="{0}">
</video>
""".format(white_output))
[MoviePy] >>>> Building video project_video_output.mp4
[MoviePy] Writing video project_video_output.mp4


100%|█████████▉| 1260/1261 [10:04<00:00,  1.94it/s]


[MoviePy] Done.
[MoviePy] >>>> Video ready: project_video_output.mp4

CPU times: user 9min 8s, sys: 51.8 s, total: 10min
Wall time: 10min 5s
Both lane and vehicle detection
white_output = 'project_video2_output.mp4'
clip = VideoFileClip("project_video2.mp4")#.subclip(t_start=30,t_end=35)
white_clip = clip.fl_image(DV.find_cars)
%time white_clip.write_videofile(white_output, audio=False)

HTML("""
<video width="960" height="540" controls>
  <source src="{0}">
</video>
""".format(white_output))
[MoviePy] >>>> Building video project_video2_output.mp4
[MoviePy] Writing video project_video2_output.mp4


100%|█████████▉| 1260/1261 [10:34<00:00,  1.96it/s]


[MoviePy] Done.
[MoviePy] >>>> Video ready: project_video2_output.mp4

CPU times: user 9min 40s, sys: 54.3 s, total: 10min 35s
Wall time: 10min 34s